 Choose → from the
main menu to launch OpenOffice.org Impress. A wizard offers you
assistance for creating a presentation, but we won't detail it
here. Just create an empty presentation by clicking
.
Choose → from the
main menu to launch OpenOffice.org Impress. A wizard offers you
assistance for creating a presentation, but we won't detail it
here. Just create an empty presentation by clicking
.
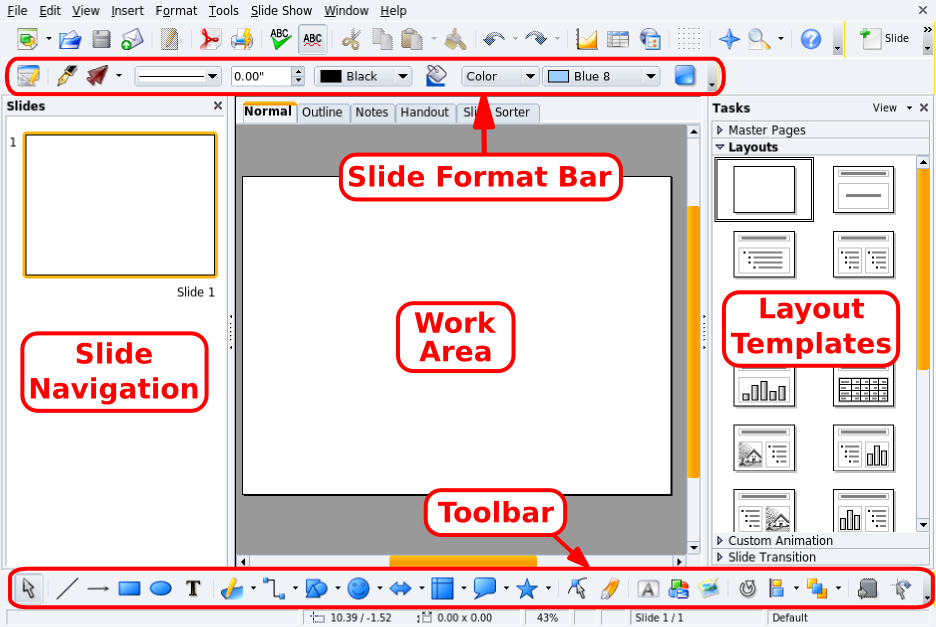
- Slide Format Bar
There are options for changing the slide shading, background color, line thickness, etc.
- Work Area
This is where you compose the slides which build your presentation.
- Toolbar
-
Contains the main tools you use to create your slides: the text, shapes, curves, lines and arrow input; object rotate, alignment and arrangement; and others.
- Layout Templates
Contains a gallery of the templates available. Just click on the template you want to switch the current slide to it.
- Slide Navigation
Displays a list of all the slides comprising the presentation. Slides are displayed as miniatures, so you can see what they look like at a glance. To open a slide, search for it in the list, then click on it.
![[Tip]](images/tip.png)
 Click on this button on the Toolbar or choose
→ from the menu to
add a new slide, after the current one, with the currently
selected slide template.
Click on this button on the Toolbar or choose
→ from the menu to
add a new slide, after the current one, with the currently
selected slide template.
 Choose → from the menu to
insert a chart diagram into the current slide. A
“default” bar chart is inserted and OpenOffice.org Impress
switches to chart mode. Click “outside” the chart
area to return to the slide design mode.
Choose → from the menu to
insert a chart diagram into the current slide. A
“default” bar chart is inserted and OpenOffice.org Impress
switches to chart mode. Click “outside” the chart
area to return to the slide design mode.
You can drag the border handles to adjust the chart's size. Double click on the drawn chart, then right-click on it and select to enter the data according to the chart you want to build (see Figure 3.4, “Entering Chart Data”).
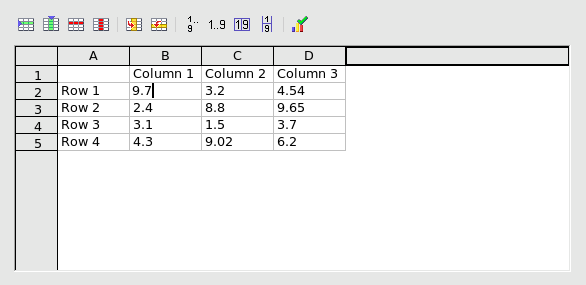
Once you have entered the chart's data, close the data entry window and click on to update the chart in the slide.
Repeat the double-click / right-click sequence to change the chart's title, legends, axis, type (2D or 3D, bar, pie, points, lines, etc.), selecting the appropriate entries from the pop-up menu.
Use the → menu and click the Background tab to define colors, gradients, patterns, or bitmapped backgrounds for the slide. Each background type has options of its own. Feel free to explore them.
![[Note]](images/note.png) |
Note |
|---|---|
Using bitmaps for backgrounds increases the file's size considerably. This could lead to a performance hit, especially on older systems. |
Once the background is selected, you can make that background the default one for all slides. Make your choice and the slide(s) background(s) will be changed.
The menu has slide transitions, animations and effects options and wizards which let you add “dynamism” to your presentations. However, you should try not to overuse transitions, animations and effects because they can be distracting to your audience, turning their attention to the effects themselves instead of the content of your presentation.